L Brands suutis analüütikute ja ka enda 4. augustil antud aktsiakasumi prognoosi lüüa 10 sendiga, tõstab majandusaasta ootuse samale tasemele analüütikute omaga
*Reports Q2 (Jul) earnings of $0.70 per share, excluding non-recurring items, $0.10 better than the Capital IQ Consensus of $0.60; revenues rose 4.5% year/year to $2.89 bln vs the $2.84 bln Capital IQ Consensus.
*Preannounced on Aug 4: Guided EPS to high end of $0.50-0.60 range; rev +5% to $2.89 bln vs. $2.84 bln consensus
*Co issues downside guidance for Q3, sees EPS of $0.40-0.45, excluding non-recurring items, vs. $0.47 Capital IQ Consensus Estimate.
*Co issues in-line guidance for FY17, raises EPS to $3.70-3.85 from $3.60-3.80, excluding non-recurring items, vs. $3.75 Capital IQ Consensus.
Harmani tegevjuht räägib Automotive News Europe'le antud intervjuus veidi ettevõttest ning infotainmenti sektori väljavaatest (link)
All the analyst groups, IHS, etc., are saying in three to five years onboard penetration of infotainment will be 60 to 65 percent globally.
--What is the current percentage of penetration for the technology?
About 25 to 27 percent.
All the analyst groups, IHS, etc., are saying in three to five years onboard penetration of infotainment will be 60 to 65 percent globally.
--What is the current percentage of penetration for the technology?
About 25 to 27 percent.
Lululemon avaldas ootuspärase teise kvartali aktsiakasumi ja müügitulu, kuid seda loodetust pisut madalama võrreldavate poodide müügitulu kasvu juures. Võimsalt tõusnud aktsia ja suhteliselt kõrge valuatsiooni juures olid prognoositavate aktsiakasumite keskpunktid pettumustvalmistavad.
Lululemon reports Q2 (Jul) earnings of $0.38 per share, excluding non-recurring items, in-line with the Capital IQ Consensus of $0.38; revenues rose 13.6% year/year to $514.52 mln vs the $515.78 mln Capital IQ Consensus.
Co issues in-line guidance for Q3 (Oct), sees EPS of $0.42-0.44 vs. $0.44 Capital IQ Consensus Estimate; sees Q3 revs of $535-545 mln vs. $542.52 mln Capital IQ Consensus Estimate. Guidance is based on total comparable sales in the mid-single digits on a constant dollar basis.
Co issues in-line guidance for FY17, sees EPS of $2.07-2.15, excluding non-recurring items, vs. $2.14 Capital IQ Consensus Estimate; sees FY17 revs of $2.325-2.350 bln vs. $2.347 bln Capital IQ Consensus Estimate. Guidance is based on total comparable sales in the mid-single digits on a constant dollar basis.
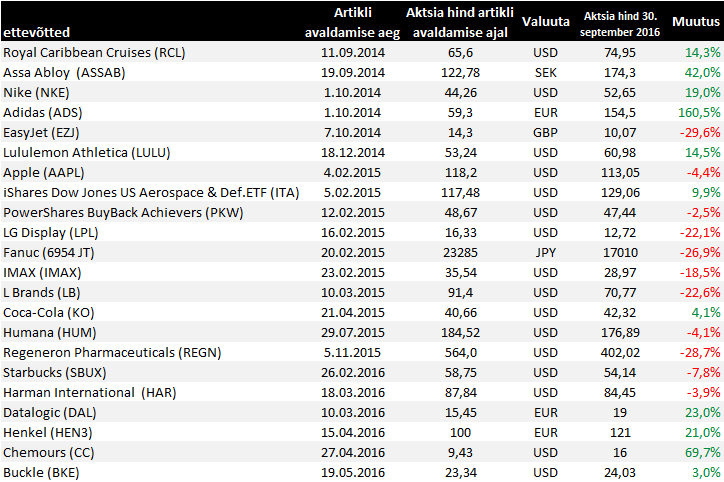
Augusti lõpu seisuga


septembri lõpu seisuga

easyJeti septembris lõppenud majandusaasta maksueelne kasum saab olema oodatust nõrgem ning ootab odavneva naela tõttu jätkuvat survet
* FY pretax expected to be range of GBP490m to GBP495m vs Bloomberg est. GBP516m; effective tax rate for financial year 2016 will be low double digits, sees beneficial impact EPS
* FX movements expected to have around GBP90m adverse impact compared to financial year to Sept. 30 2015, an increase of GBP35m since June 23.
* FX headwind to continue into 2017 driven by weaker GBP against USD affecting cost of fuel. Total expected foreign exchange impact for the year to Sept. 30 2017 is around GBP90m
L Brandsi võrreldavate poodide müük kasvas septembris tavapäraselt konservatiivsest prognoosist veidi rohkem, oktoobris oodatakse single digits kasvu
L Brands reports September same store sales +3% vs flat guidance, +9% last year
Buckle'i langustempo jätkus eelmise kuuga sarnases tempos
Buckle reports September same store sales -15% vs -6.7% year ago and -14.8% last month
L Brands reports September same store sales +3% vs flat guidance, +9% last year
Buckle'i langustempo jätkus eelmise kuuga sarnases tempos
Buckle reports September same store sales -15% vs -6.7% year ago and -14.8% last month
Jälgime edaspidi ka Humana tegemisi lähemalt: Humana lõikab kasu Rootsi uuest eelarvest
IMAXilt oodatust paremad tulemused, uute tellimuste pealevool oli kvartalis rekordiline
Reports Q3 (Sep) adj. earnings of $0.12 per share, $0.04 better than the Capital IQ Consensus of $0.08; revenues rose 1.8% year/year to $86.6 mln vs the $73.03 mln Capital IQ Consensus.
Theatre signings 162 vs. 35 last year; theater installations 50 vs. 44 last year; total 1145 vs. 1008. There were 547 theatres in backlog as of Sept. 30, 2016, up 23.8% from the 442 in backlog as of June 30, 2016.
Assa Abloy ületab küll müügitulu ootust, kuid jääb ärikasumiga alla ning Hiina nõudlus on jätkuvalt murekohaks
• Assa Abloy 3Q operating income SEK3.02b vs est. SEK3.08b, margin 16.8% vs 17.0% year earlier.
• 3Q sales SEK18.03b vs est. SEK17.9b; organic growth 2%
• Saw strong growth for Global Technologies and Americas, good growth for Entrance Systems and growth for EMEA; negative growth for Asia Pacific due to weak demand in China
• Mature markets made good progress; growth markets continued to show subdued demand, apart from Latin America and India
• While many emerging markets are stagnating, strategy of expanding on emerging markets is unchanged
Apple avaldas eile suhteliselt ootuspärase neljanda kvartali müügitulu ning kasumi. Ja kuigi detsembri käibe ootus ületas konsensuse oma, siis väikeseks pettumuseks oli brutokasumimarginaali prognoos.
Apple reports Q4 (Sep) earnings of $1.67 per share, $0.01 better than the Capital IQ Consensus of $1.66; revenues fell 9.0% year/year to $46.85 bln vs the $46.98 bln Capital IQ Consensus. Apple reports Q4 gross margins 38.0% vs 38% ests vs 39.9% last year.
iPhone shipments 45.5 mln vs 45.2 million ests and 48.05 million last year.
iPads 9.3 mln vs 9.3 million ests versus 9.9 million in Q4 of last year.
Macs 4.9 mln vs 5.2 million ests versus 5.7 million in Q4 of last year.
Co issues upside guidance for Q1, sees Q1 revs of $76-78 bln vs. $75.33 bln Capital IQ Consensus; gross margins of 38.0-38.5% vs 39% ests vs 40.1% last year; op-ex $6.9-7.0 bln;
Apple guidance implies Q1 net income of ~$16.5-17.4 bln vs. $18.36 bln last year; Implies Q1 EPS of ~$3.11-3.28 vs. $3.19 consensus.
"We are pleased to have generated $16.1 billion in operating cash flow, a new record for the September quarter."
Rev by geography: Americas -7%; Europe +3%, Greater China -30%; Japan +10%, Asia Pac. -1%.
Royal Caribbean teenib ootuspärase müügitulu pealt oodatust veidi rohkem kasumit. Q4 prognoos jääb konsensuse omale alla, kuid kinnitab varasemat 2017.a väljavaadet
Reports Q3 (Sep) earnings of $3.20 per share, excluding non-recurring items, $0.10 better than the Capital IQ Consensus of $3.10; revenues rose 1.6% year/year to $2.56 bln vs the $2.58 bln Capital IQ Consensus.
Co issues downside guidance for Q4, sees EPS of ~$1.20, excluding non-recurring items, vs. $1.25 Capital IQ Consensus; net yields +4.5%.
Co reaffirms guidance for FY17, targeting EPS of $6.78, excluding non-recurring items, vs. $6.89 Capital IQ Consensus Estimate.
At this time, 2017 itineraries are booked ahead of last year in both rate and volume. New ships including Harmony of the Seas and Ovation of the Seas are seeing strong trends, supporting a solid outlook for 2017.
L Brands ütles eile õhtul, et kolmanda kvartali aktsiakasum jääb ootuse vahemiku alumisse äärde ning oktoobri võrreldavate poodide müügi puhul olid turu ootused ka tõenäoliselt kõrgemad
Co issues downside guidance for Q3 (Oct), sees Q3 EPS of ~$0.40, prior $0.40-0.45 vs. $0.46 Capital IQ Consensus Estimate.
LB guides for October same store sales +1% (VS -2%, BBW +6%) vs +LSD growth guidance and last year's Oct SSS of +5% (VS +7%, BBW+5%), last moth's +3% (VS 0%, BBW +9%).
Co issues downside guidance for Q3 (Oct), sees Q3 EPS of ~$0.40, prior $0.40-0.45 vs. $0.46 Capital IQ Consensus Estimate.
LB guides for October same store sales +1% (VS -2%, BBW +6%) vs +LSD growth guidance and last year's Oct SSS of +5% (VS +7%, BBW+5%), last moth's +3% (VS 0%, BBW +9%).
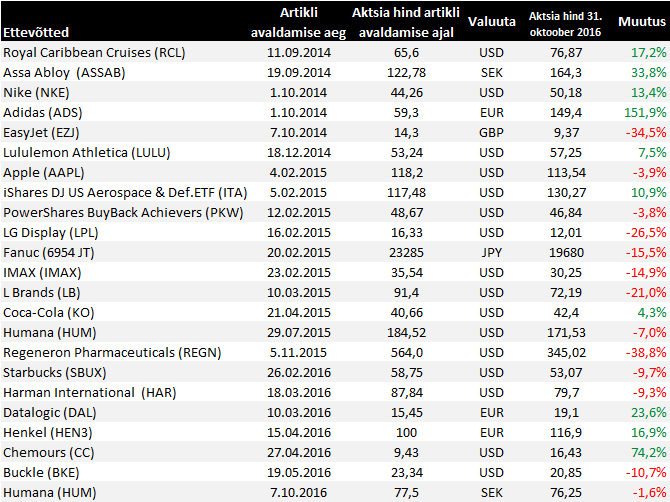
Muutused 31. oktoobri seisuga

Adidasselt suuresti ootuspärased tulemused, kinnitatakse varasemaid 2016.a prognoose vaatamata sellele, et Reeboki brändi restruktureerimine toob neljandas kvartalis kaasa 20 miljonit eurot erakorralist lisakulu.
*Adidas 3Q sales EU5.41b, est. EU5.38b.
* 3Q gross margin 47.6%, est. 48%
* 3Q operating profit EU563m, est. EU565m
* 3Q net income EU386m, est. EU389m
* 3Q total FX-adjusted sales up 17%, est. up 16.4%
* Confirms 2016 forecast:
* FX-neutral sales up in high teens
* Gross margin 48%-48.3%
* Operating margin up to 7.5%
* Net income from cont. ops up 35%-39% to between EU975m and EU1b
Harman alustas fiskaalaastat oodatust parema müügitulu ning aktsiakasumiga
Harman reports Q1 (Sep) earnings of $1.87 per share, $0.33 better than the Capital IQ Consensus of $1.54; revenues rose 7.9% year/year to $1.76 bln vs the $1.74 bln Capital IQ Consensus.
Harman reports Q1 (Sep) earnings of $1.87 per share, $0.33 better than the Capital IQ Consensus of $1.54; revenues rose 7.9% year/year to $1.76 bln vs the $1.74 bln Capital IQ Consensus.
Eile õhtul avalikustas kolmanda kvartali majandustulemused Chemours. Müügitulu oli $1,4 miljardit, mida on 6% vähem kui möödunud aastal. Languse põhjuseks olid peamiselt müüdud üksused, kelle müüginumbrid sisaldusid eelmise aasta numbrites, kuid puudusid käesoleva aasta kolmanda kvartali omadest. Titaandioksiidi müügist laekus ettevõttele $625 miljonit, mis oli marginaalselt parem kui eelmisel aastal. Toetavateks teguriteks on tõusnud hinnad ning suuremad müüdud kogused kõikides regioonides peale Hiina. Endiselt läheb hästi Fluoroproducts segmendis, kus nõudluse kasv Opteoni kemikaali järele kaalub üles valitsuse regulatsioonidest tuleneva languse teiste jahutuskemikaalide müügis ning konkurentsist tuleneva hinnasurve.
Ettevõtte kolmanda kvartali puhaskasumiks kujunes $204 miljonit, kuid nagu varasematel kvartalitelgi, on siingi ühekordse iseloomuga tegureid – kasu müüdud varadelt $169 miljonit ja immateriaalsete varade mahakirjutamist $46 mln. Ilma nendeta oleks puhaskasum olnud $81 miljonit ehk $0,44 aktsia kohta.
Möödunud kvartalil teenis ettevõte vaba rahavoogu $132 mln vs $8 mln aasta tagasi. Aasta esimese üheksa kuuga on Chemours teeninud $324 miljonit rahavoogu äritegevusest (-$120 mln eelmise aasta samal perioodil).
Endiselt jätkub restruktureerimisprogrammi läbiviimine tänu millele suudeti kvartalis kulusid $60 mln võrra koomamale tõmmata. Kolmanda kvartali jooksul ja pärast kvartali lõppu ostis Chemours tagasi $315 mln väärtuses võlakirju, millest tulenevalt vähenevad intressikulud $19 mln võrra aastas. Ettevõtte võlakoormus oli septembri lõpu seisuga $3,8 mld ning bilansis oli raha ligi $1 mld ulatuses. Alates eelmise aasta lõpust on netovõlg langenud $3,5 mld pealt $2,8 miljardini.
Paar päeva tagasi teatas oma tulemused Henkel, raporteerides üsna ootuspärased numbrid ning kinnitades selle aasta prognoose. Järgmine oluline sündmus saab olema strateegiapäev 17. novembril.
*Henkel 3Q sales EU4.75b (+3.4% YoY) , est. EU4.81b
*Adjusted for negative foreign exchange impact of 3.3 percent, sales increased by 6.7 percent.
*Henkel 3Q total organic sales growth +2.8%, est. +2.9%
*Henkel 3Q adj. operating profit EU837m, est. EU829.3m.
*Henkel 3Q adj. earnings per pref. share EU1.42, est. EU1.43
* CEO Hans Van Bylen says in statement that expects the overall challenging and uncertain market environment to persist in 2016
* Says co. will continue to focus on leveraging its successful brands, leading market positions and strong innovation capabilities to achieve its ambitious targets
* Confirms 2016 outlook:
* Organic sales growth 2%-4%
* Adj. Ebit margin expected to rise to more than 16.5%
* Adj. earnings per preferred share to grow between 8%-11%
Kuna Chemoursi artikli juures mainisin, et oman isiklikult ettevõtte aktsiaid, siis arvan, et oleks õiglane mainida, et eilse seisuga müüsin oma osaluse ettevõttes. Kuigi hoiame endiselt Chemoursi tegemistel silma peal (mistõttu jääb ettevõte ka nimekirja), siis mulle tundub, et ettevõte on saavutanud oma õiglase väärtuse.
Samsung otsib uusi kasvuväljasid ning otsustas osta Harmani ära
Harman announced that they have entered into a definitive agreement under which Samsung will acquire HARMAN for $112.00 per share in cash, or total equity value of ~$8.0 billion.
Harman announced that they have entered into a definitive agreement under which Samsung will acquire HARMAN for $112.00 per share in cash, or total equity value of ~$8.0 billion.