Kuulujutt liikvel, et Sony olla huvitet TTWO soetamisest $130 pealt, kuulujutt siiski seni.
Marketwatch: Take-Two Interactive Software TTWO, +6.88% shares jumped 6.9%, its best day since October 2018. Joel Kulina, head of technology and media trading at Wedbush Securities, referenced rumors about potential takeover interest from Sony Corp. SNE, +0.76% in a note to clients.
H&Mi esimese kvartali müük oodust veidi parem, kasumlikkuse kohta saame teada märtsi lõpus
* 1Q sales SEK51.02 billion, estimate SEK50.05 billion (range SEK49.27 billion to SEK50.42 billion) (Bloomberg data)
* 1Q sales in local currencies rose 4%
* 1Q sales SEK51.02 billion, estimate SEK50.05 billion (range SEK49.27 billion to SEK50.42 billion) (Bloomberg data)
* 1Q sales in local currencies rose 4%
Jaanuari keskel positiivse kasumihoiatuse andnud Lululemoni jaoks kujunes neljas kvartal arvatust isegi veelgi paremaks ning lisaks viitavad prognoosid väga tugevale eelseisvale aastale.
Lululemon reports Q4 (Jan) earnings of $1.85 per share, $0.10 better than the S&P Capital IQ Consensus of $1.75; revenues rose 25.6% year/year to $1.17 bln vs the $1.15 bln S&P Capital IQ Consensus.
Co issues guidance for Q1, sees EPS of $0.68-0.70 vs. $0.67 S&P Capital IQ Consensus; sees Q1 revs of $740-750 mln vs. $742.73 mln S&P Capital IQ Consensus, based on a total comparable sales increase in the low-double digits on a constant dollar basis vs. +8% ests in USD.
Co issues guidance for FY20, sees EPS of $4.48-4.55 vs. $4.40 S&P Capital IQ Consensus; sees FY20 revs of $3.70-3.74 bln vs. $3.71 bln S&P Capital IQ Consensus, based on a total comparable sales increase in the low-double digits on a constant dollar basis vs. +8.2% ests in USD
Int'l growing much faster than North America, starting to move the needle; Asia >70%, Europe >55%
Really happy w/NA growth
Reached 2020 targets early; well-positioned to deliver $4 billion annual revenue in 2020
Very excited about digital business; online gross margin helped by few returns
Sees continued upside in gross margin due to product gross margin
Analyst Day April 24
Easyjet tõdeb, et märtsis lõppenud poolaasta kujunes ootuspäraseks, ent teine pool toob Brexiti tõttu kaasa suuremat määramatust
* Total 1H revenue is expected to grow by about 7.3% to about GBP2.34b, with seat capacity increasing by circa 14.5% to circa 46.2m
** Revenue per seat at constant currency is expected to have declined by circa 7.4%, in line with previous guidance of a mid to high single digit decline for the half
* “Macroeconomic uncertainty and many unanswered questions surrounding Brexit are together driving weaker customer demand,” the company said in a statement Monday at the start of its fiscal third quarter. “Our outlook for the second half is now more cautious.”
* Seeing increasing softness in ticket yields in the U.K. and across Europe;
* Despite this, 2H revenue per seat at constant currency is expected to be slightly up, which reflects weakening 3Q
underlying demand and an expected year on year uptick in 4Q, driven by a program of yield initiatives and an assumption of a more certain Brexit outlook
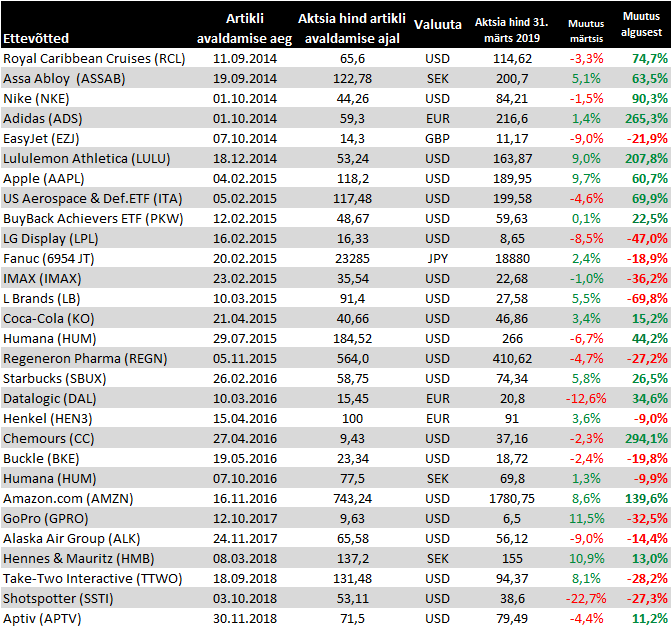
Liikumised märtsi seisuga

Lisan Zoomi 60 dollari pealt tabelisse, et hoida tulevikus silma peal. Pikemalt võib lugeda siit. Kiiresti kasvav ja kasumlik Zoom läheb börsile
Coca-Cola üllatusi ei paku
Coca-Cola reports Q1 (Mar) earnings of $0.48 per share, excluding non-recurring items, $0.02 better than the S&P Capital IQ Consensus of $0.46; revenues rose 5.3% year/year to $8 bln vs the $7.89 bln S&P Capital IQ Consensus. Organic revenues (non-GAAP) grew 6%. An estimated 2 points of revenue growth was attributable to timing, primarily related to bottler inventory build in order to manage uncertainty related to Brexit. Additionally, the quarter included one less day, which resulted in an approximate 1-point headwind to revenue growth.
Co reaffirms guidance for FY19, sees EPS of $2.05-2.10, excluding non-recurring items, vs. $2.09 S&P Capital IQ Consensus. Reaffirms FY19 outlook: ~4% growth in organic revenues (non-GAAP) -- No Change 12% to 13% growth in comparable currency neutral net revenues (non-GAAP), including an 8% to 9% tailwind from acquisitions, divestitures and structural items Comparable net revenues (non-GAAP): 3% to 4% currency headwind based on the current rates and including the impact of hedged positions.
Full Year 2019 Operating Income: 10% to 11% growth in comparable currency neutral operating income (non-GAAP), including a low single-digit tailwind from acquisitions, divestitures and structural items Comparable operating income (non-GAAP): 6% to 7% currency headwind based on the current rates and including the impact of hedged positions Full Year 2019 EPS: -1% to 1% growth versus $2.08 in 2018 in comparable EPS from continuing operations (non-GAAP).
Amazon raporteeris ootuspärase käibe juures arvatust parema kasumi, osalt tänu rahvusvahelise äri kasumlikkuse paranemisele, jättes selle üksuse üsna lähedale nullkasumi piirist (90 mln USD kahjumit lõppenud kvartalil vs üle 600 mln kahjumit mullu samal ajal). Teise kvartali müügitulu ootus vastab konsensuse nägemusele, samas ärikasum tõotab jääda pisut alla, ent Q1 näitas, et Amazon võib selles osas olla konservatiivne. Olulise uudisena lühendatakse Prime klientide tasuta kahe päeva tarne ühe päeva peale, mis ühest küljest aitab ettevõttel saavutada e-kaubanduse kasvanud konkurentsis täiendavat eelist, ent eeldab lähiajal ka investeeringute suurendamist.
Amazon reports Q1 (Mar) earnings of $7.09 per share, $2.43 better than the S&P Capital IQ Consensus of $4.66; revenues rose 17.0% year/year to $59.7 bln vs the $59.73 bln S&P Capital IQ Consensus. Operating income +129% to $4.4 bln vs. $3.1 bln consensus and $2.3-3.3 bln guidance
NA sales +17% to $35.8 bln; operating income +99% to $2.3 bln
AWS +42% to $4.7 bln, operating income +59% to $2.2 bln (margin +320 bps to 28.9%).
Int'l sales +16% to $16.2 bln; Online stores +12%, 3P services +23%, Sub services +42% Advertising/other +36% to $2.7 bln
Co issues in-line guidance for Q2, sees Q2 revs of $59.5-63.5 bln vs. $62.42 bln S&P Capital IQ Consensus, to grow between 13% and 20% compared with second quarter 2018. This guidance anticipates an unfavorable impact of ~150 basis points from foreign exchange rates. Operating income $2.6-3.6 billion vs. $4.2 bln consensus, compared with $3.0 billion in second quarter 2018.
Amazon on call announces free Prime two day shipping will become free one day shipping
This is adding $800 mln in incremental costs to the second quarter. Amazon already offers free same day/one day but core Prime offering of free shipping will get cut to one day from two days. Other costs will rise in Q2 as well.
Eile avaldas oma tulemused Assa Abloy, aga kuna aktsia on aasta algusest 35% kallinenud ning jõudnud uuele rekordile, siis tõid üsna ootuspärased numbrid kerge kasumivõtu
* 1Q Ebit SEK3.25 billion, estimate SEK3.28 billion (range SEK3.16 billion to SEK3.34 billion) (Bloomberg data)
* 1Q sales SEK21.51 billion, estimate SEK21.29 billion (range SEK20.73 billion to SEK21.55 billion) (BD)
* 1Q organic revenue +5%
* Says all divisions reported organic growth; "growth continued to be particularly strong in the Americas and Global
Technologies divisions. Entrance Systems and EMEA reported good growth while Asia Pacific’s external growth was flat"
* "Sales growth for electromechanical products remains particularly strong and now represents 31% of total sales"
* Says operating cash more than doubled to SEK1.17b from SEK575m
Eile teatas oma numbrid Starbucks, raporteerides ootuspärase müügitulu juures arvatust pisut tugevama aktsiakasumi. Käesoleva majandusaasta oodatava EPS liigub kõrgemale aga ettevõtte sõnul tuleneb 2/3 sellest maksudest ning ülejäänud siiani arvatust paremaks osutunud esimese poolaasta tulemustest.
Reports Q2 (Mar) earnings of $0.60 per share, excluding non-recurring items, $0.03 better than the S&P Capital IQ Consensus of $0.57; revenues rose 4.5% year/year to $6.31 bln vs the $6.33 bln S&P Capital IQ Consensus.
Global comparable store sales increased 3% (vs 3.1% estimate), driven by a 3% increase in average ticket
Americas and U.S. comparable store sales increased 4%, driven by a 4% increase in average ticket
China/Asia Pacific comparable store sales increased 2%, driven by a 2% increase in average ticket; China comparable store sales increased 3%, with comparable transactions down 1%
Co issues upside guidance for FY19, sees EPS of $2.75-2.79 (prior $2.68-$2.73), excluding non-recurring items, vs. $2.73 S&P Capital IQ Consensus.
Global comparable store sales growth between 3% and 4% (previous guidance of near the lower-end of its 3-5% range)
Continues to expect to add Approximately 2,100 net new Starbucks stores globally
Imax jääb müügituluga alla, kuid ületab sendiga aktsiakasumi ootust. Avengers Endgame'i eel usutakse, et 2019. saab olema nende jaoks suurima kassatuluga aasta (kassatulu andis 57% esimese kvartali müügitulust, ülejäänud tuli IMAX süsteemide müügist, liisimisest, hooldusest ja filmide töötlemisest/levitamisest).
Reports Q1 (Mar) earnings of $0.18 per share, excluding non-recurring items, $0.01 better than the S&P Capital IQ Consensus of $0.17; revenues fell 5.6% year/year to $80.2 mln vs the $81.29 mln S&P Capital IQ Consensus.
During the quarter, the Company installed 17 theater systems, 14 of which were for new theater locations.
The gross margin across all segments in the first quarter of 2019 was $45.1 million, or 56.3% of total revenues, compared to $50.7 million, or 59.6% of total revenues, in the first quarter of 2018.
"IMAX raises full-year 2019 box office guidance following better-than-expected first quarter. Company currently anticipates IMAX global box office will see low-double digit percentage growth, compared to 2018... IMAX delivers second strongest box office quarter of all time in China, up 19% to $106 million."
Apple'ilt arvatust paremad tulemused ning Tim Cookilt positiivsed kommentaarid iPhone'i müügi languse aeglustumisest kvartali lõpus, mis peegelduvad ka konsensust kõrgemas kolmanda kvartali müügitulu ootuses
Apple reports Q2 (Mar) earnings of $2.46 per share, $0.10 better than the S&P Capital IQ Consensus of $2.36; revenues fell 5.1% year/year to $58.02 bln vs the $57.4 bln S&P Capital IQ Consensus. Gross m,argin 37.6% vs. 37-38% guidance, in-line with estimates.
iPhone rev -17% to $31.05 bln vs. $31 bln ests
Service rev +16% to $11.45 bln vs. $11.4 bln ests; gross margin +100 bps sequentially 63.8% vs 60% est (Best quarter ever for services.)
Wearables, Home and Accessories +30% to $5.13 bln; iPad +22% to $4.87 bln (iPad revenue growth rate was highest in 6 years.)
Americas rev +3% to $25.6 bln; Europe rev -6% to $13.05 bln; Greater China -22% to $10.22; Japan +1% to $5.5 bln; A-Pac -9% to $3.62 bln.
Co issues upside guidance for Q3, sees Q3 revs of $52.5-54.5 bln vs. $52.09 bln S&P Capital IQ Consensus; gross margin 37-38% vs. 37.9% ests
Apple increases quarterly dividend to $0.77/share from $0.73/share and authorizes an additional $75 billion for share repurchases
Royal Caribbean avaldas oodatust parema esimese kvartali müügitulu ja kasumi, kuid kogu majandusaasta oodatav kasum jääb ühe õnnetuse, kütuse kallinemise ja valuutade ebasoodsamate liikumiste tõttu arvatust madalamaks.
Reports Q1 (Mar) earnings of $1.31 per share, excluding non-recurring items, $0.20 better than the S&P Capital IQ Consensus of $1.11; revenues rose 20.3% year/year to $2.44 bln vs the $2.38 bln S&P Capital IQ Consensus.
Co issues in-line guidance for Q2, sees EPS of $2.45-2.50, excluding non-recurring items, vs. $2.48 S&P Capital IQ Consensus.
Co issues downside guidance for FY19, sees EPS of $9.65-9.85, excluding non-recurring items, vs. $9.94 S&P Capital IQ Consensus. Note: This range includes the negative impact of $0.25/sh from the shipyard incident for Oasis of the Seas (two construction cranes collapsed on the stern of the ship causing extensive damage) and also includes the negative impact of approximately $0.25 per share from currency and fuel since the January guidance. Better Q1 results and an improved revenue outlook are offsetting the vast majority of these two negative impacts. Excluding these impacts, Adjusted EPS would have been in the range of $10.15 to $10.35 per share.
Humana, mille aktsia on sarnaselt teiste USA ravikindlustajatega pihta saanud seoses ühiskonnas kasvanud debatiga riikliku ravikindlustussüsteemi loomisest, avaldas arvatust parema esimese kvartali kasumi ja müügitulu ning tõstis kogu majandusaasta oodatava aktsiakasumi vahemiku alumist äärt.
Reports Q1 (Mar) earnings of $4.48 per share, excluding non-recurring items, $0.18 better than the S&P Capital IQ Consensus of $4.30; revenues rose 12.8% year/year to $16.11 bln vs the $15.67 bln S&P Capital IQ Consensus.
Co issues raised guidance for FY19, sees EPS of $17.25-17.50 from $17.00-17.50 vs. $17.41 S&P Capital IQ Consensus.
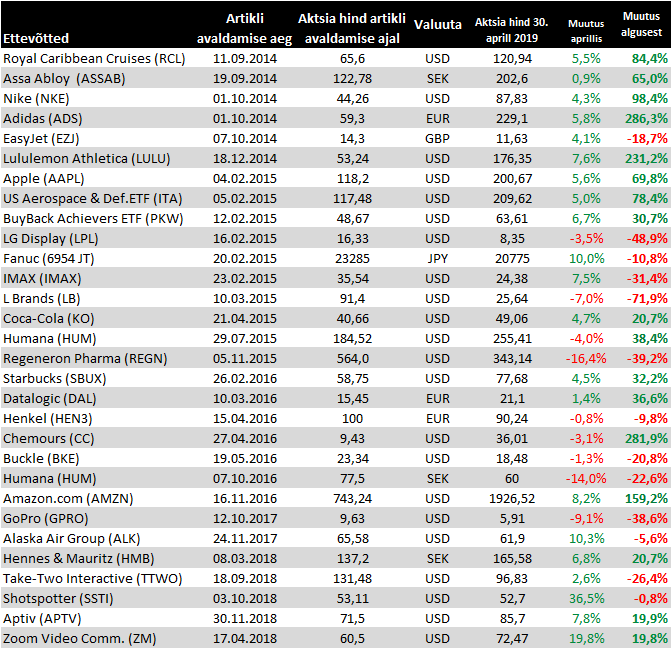
Muutused 30. aprilli seisuga

XPO Logistics jäi küll tabelisse lisamata, aga olgu siinkohal toodud ka selle firma eile avaldatud esimese kvartali tulemused, kus müügituluga jäädi alla aga aktsiakasum osutus paremaks. FedExi numbrite ning eurotsooni majanduse edasise jahtumise valguses on tõenäoliselt positiivseks uudiseks varasematele majandusaasta prognoosidele truuks jäämine, kuid see võib olla juba hinda sisse arvestatud vaadates aktsia üle 30% rallit viimase pooleteise kuu jooksul.
XPO Logisctics reports Q1 (Mar) earnings of $0.51 per share, excluding non-recurring items, $0.10 better than the S&P Capital IQ Consensus of $0.41; revenues fell 1.7% year/year to $4.12 bln vs the $4.25 bln S&P Capital IQ Consensus.
Co comments on guidance for FY19:
Continues to see FY19 revs of $17.79-18.14 bln (+3-5%) [Corresponds to organic revenue growth of 5.5% to 7.5% vs. prior outlook for 4% to 6%] vs. $17.86 bln S&P Capital IQ Consensus.
Continues to see Adjusted EBITDA in the range of $1.650 billion to $1.725 billion, an increase of 6% to 10% year-over-year
Continues to see Free cash flow in the range of $525 million to $625 million;
Aptivi esimese kvartali tulemused osutusid arvatust paremaks aga ootused valmistavad pettumuse sõidukite tagasihoidlikuma tootmise, valuutade liikumise ning toorainete tõttu
Aptiv reports Q1 (Mar) earnings of $1.05 per share, excluding non-recurring items, $0.04 better than the S&P Capital IQ Consensus of $1.01; revenues fell 1.5% year/year to $3.58 bln vs the $3.46 bln S&P Capital IQ Consensus. Adjusted for currency exchange, commodity movements and divestitures, revenue increased by 4% in the first quarter. This reflects growth of 7% in North America and 6% in Europe, partially offset by a decline of 12% in South America and 1% in Asia, which includes a decline of 12% in China.
Co issues downside guidance for Q2, sees EPS of $1.11-1.17, excluding non-recurring items, vs. $1.37 S&P Capital IQ Consensus; sees Q2 revs of $3.6-3.7 bln vs. $3.74 bln S&P Capital IQ Consensus.
Co issues downside guidance for FY19, sees EPS of $4.90-5.10 from $5.25-5.45, excluding non-recurring items, vs. $5.34 S&P Capital IQ Consensus; sees FY19 revs of $14.425-14.825 bln from $14.6-15.0 bln vs. $14.89 bln S&P Capital IQ Consensus.
"While our revised outlook for the year reflects softer global vehicle production and further headwinds from foreign exchange and commodities compared to our prior guidance, we continue to see the benefits of our flexible operating model and technology portfolio position us well for outperformance as these headwinds mitigate in the back half of the year and into 2020. Our mission to be our customers' partner of choice, uniquely providing the brain and nervous system of the vehicle, has created a sustainable business advantage for Aptiv, which in turn allows us to deliver long-term value to our shareholders through innovation, effective execution, profitable growth, strong cash flow generation and disciplined capital deployment."
Berkshire Hathaway portfellihaldurid on Amazoni ostnud
Report: Warren Buffett's Berkshire Hathaway buys Amazon shares
Report: Warren Buffett's Berkshire Hathaway buys Amazon shares
Chemoursi tulemused jäid ootustele alla, kuid teisel poolaastal nähakse turu taastumist
Chemours reports Q1 (Mar) earnings of $0.63 per share, excluding non-recurring items, $0.31 worse than the S&P Capital IQ Consensus of $0.94; revenues fell 20.5% year/year to $1.38 bln vs the $1.52 bln S&P Capital IQ Consensus.
Results were driven primarily by lower volume in Titanium Technologies, resulting in a 20 percent decrease in net sales, partially offset by a 1 percent increase in global average prices across all segments.
Fluoroproducts segment net sales in the first quarter were $687 million in comparison to $732 million in the prior-year quarter. Illegal
Co said, "Despite a soft first quarter, the underlying fundamentals across our business remain solid. We anticipate titanium dioxide markets will stabilize as we move into the second half of 2019, and believe that we are well positioned in all our markets headed into the spring.
Henkeli ilutoodete üksus muutis ettevõtte esimese kvartali tulemuse arvatust pehmemaks, kuid majandusaasta prognoosid jäeti siiski samaks
* Henkel 1Q sales rise 2.8% to EU4.969b, est. EU4.99b
* Adj. Ebit falls 5.6% to EU795m (est EU805.8m)
* "In our consumer goods businesses, the performance of Beauty Care was below our expectations”: CEO Hans Van Bylen
** “We faced negative developments of our retail business in key regions such as Western Europe and China. We are addressing this development with targeted measures, aiming to boost growth and improve the performance of our Beauty Care business”
* Confirms outlook for 2019
** “We expect an organic sales growth of between 2 and 4 percent in the current fiscal year. For the adjusted EBIT margin, we expect a range of 16 to 17 percent and an adjusted EPS in the mid-single percentage range below prior year at constant exchange rates”: CEO